Google Ads Report Template
Get a better understanding of Google Ads Now
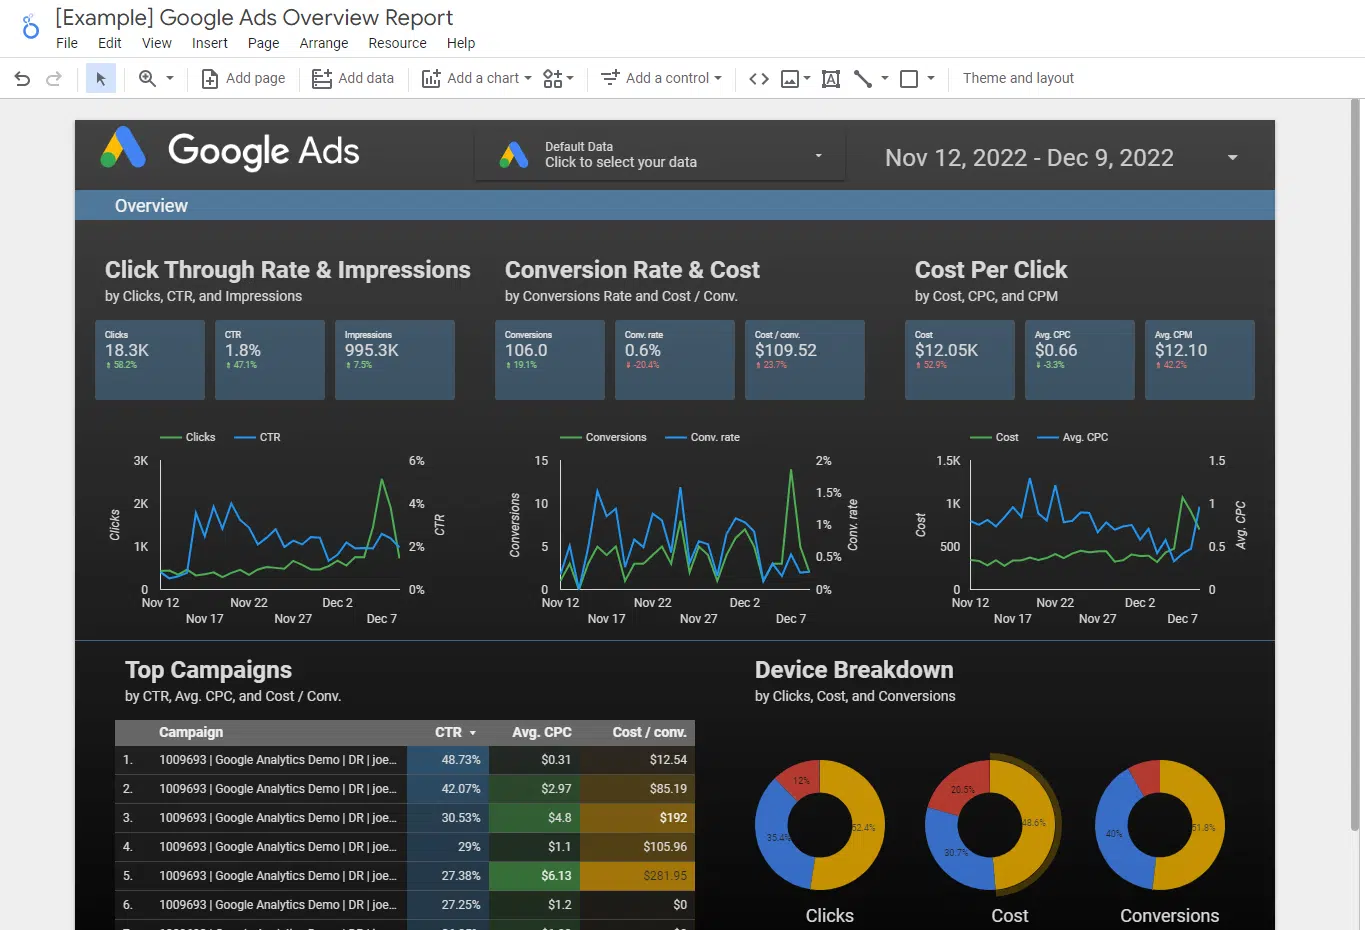
Our Looker Studio template simplifies Google Ads analysis, providing a clear and detailed view of your ad performance. It’s designed for both service and e-commerce businesses, integrating seamlessly with your CRM or shopping cart platform for accurate sales revenue reporting. This aligns with Google’s recommendations to service providers (lead generation) to import sales revenue and lead lifecycle changes as offline conversions. This allows Google to score leads and therefore optimise for lead quality, not just quantity.
The report, encompassing over 20 pages, includes a side navigation bar for swift access to various metrics, aiding in the effective understanding and optimisation of your Google Ads campaigns.
Starting is easy: duplicate the template and connect it to your Google Ads dataset. We offer comprehensive guidance to ensure a smooth and straightforward setup, allowing you to quickly leverage this tool for enhanced advertising results.
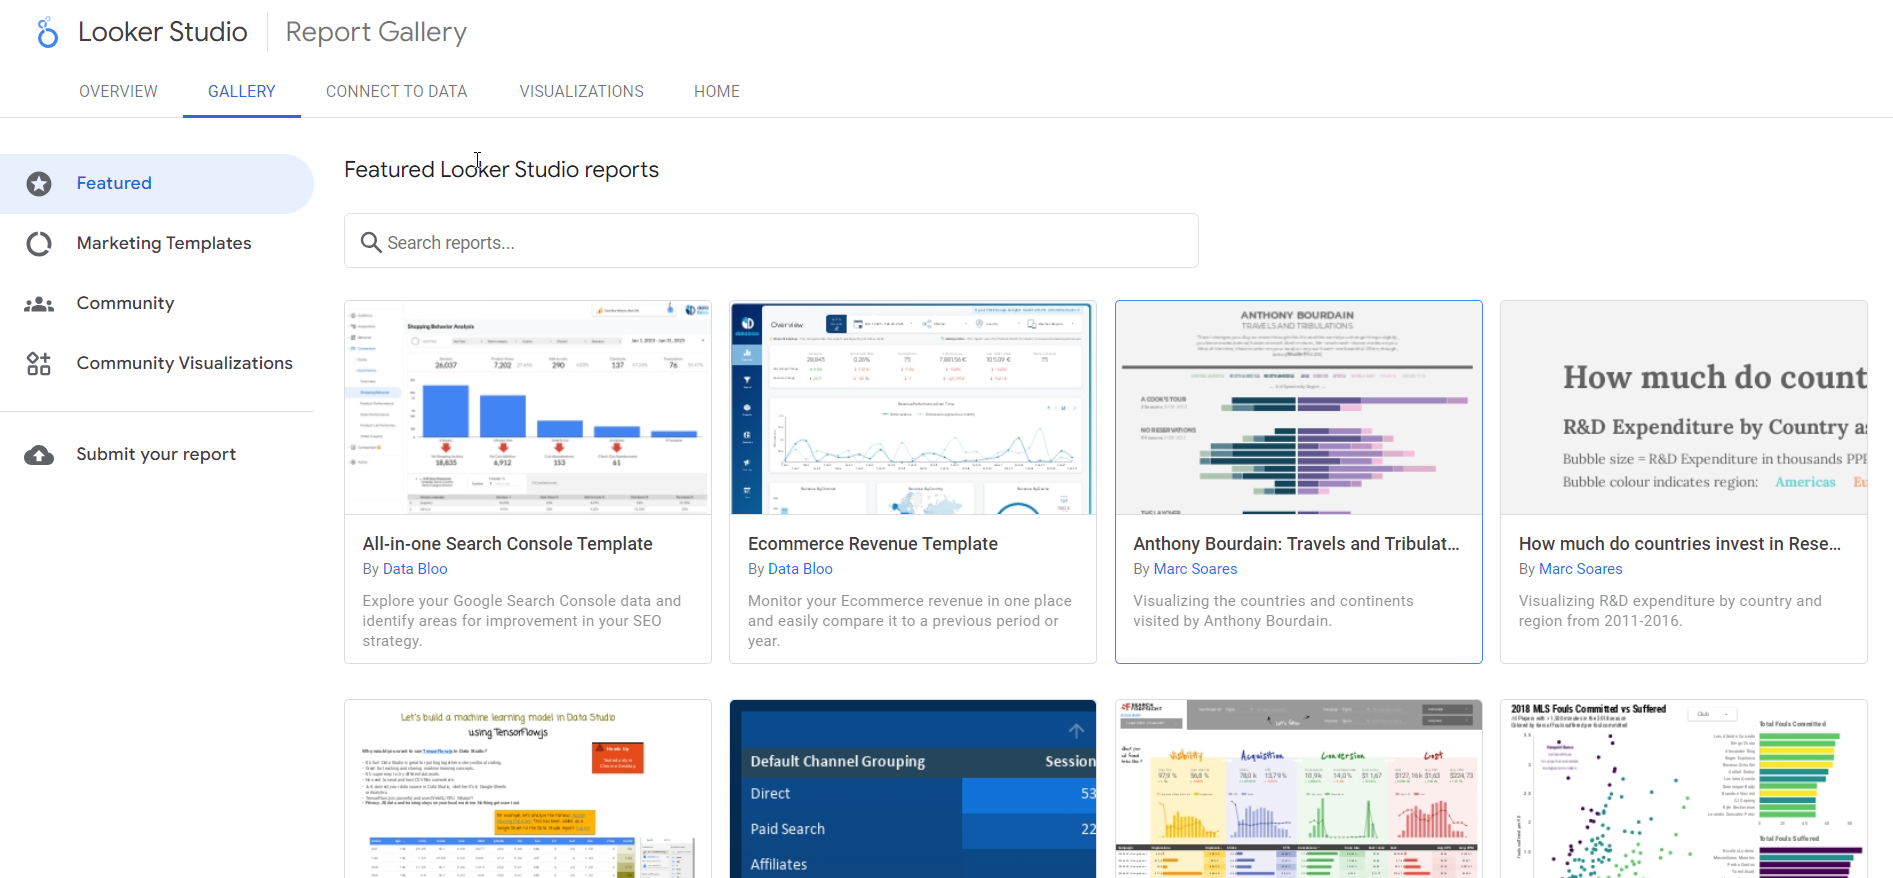
How our Looker Studio Template for Google Ads Works
Our comprehensive Looker Studio template for Google Ads spans over 20 pages, featuring a user-friendly navigation bar for seamless page-to-page transition. Enhanced with a blue header, the report offers advanced drop-down controls for data filtering, accessible on every page. These filters allow you to conduct in-depth analysis across various parameters like account, campaign type, and ad type, enabling a detailed understanding of your ad performance.
The template’s design empowers you to focus on specific campaign elements, providing insights to optimise strategies and improve your return on ad spend (ROAS). With its broad analysis and real-time data updates, this report is a powerful tool to refine your Google Ads approach, reduce cost per lead, and maximise efficiency.
In the following sections, we’ll explore the dashboard overview, key metrics, and how to effectively use the navigation and filtering tools for maximum insight into your advertising campaigns.
Dashboard Summary Report
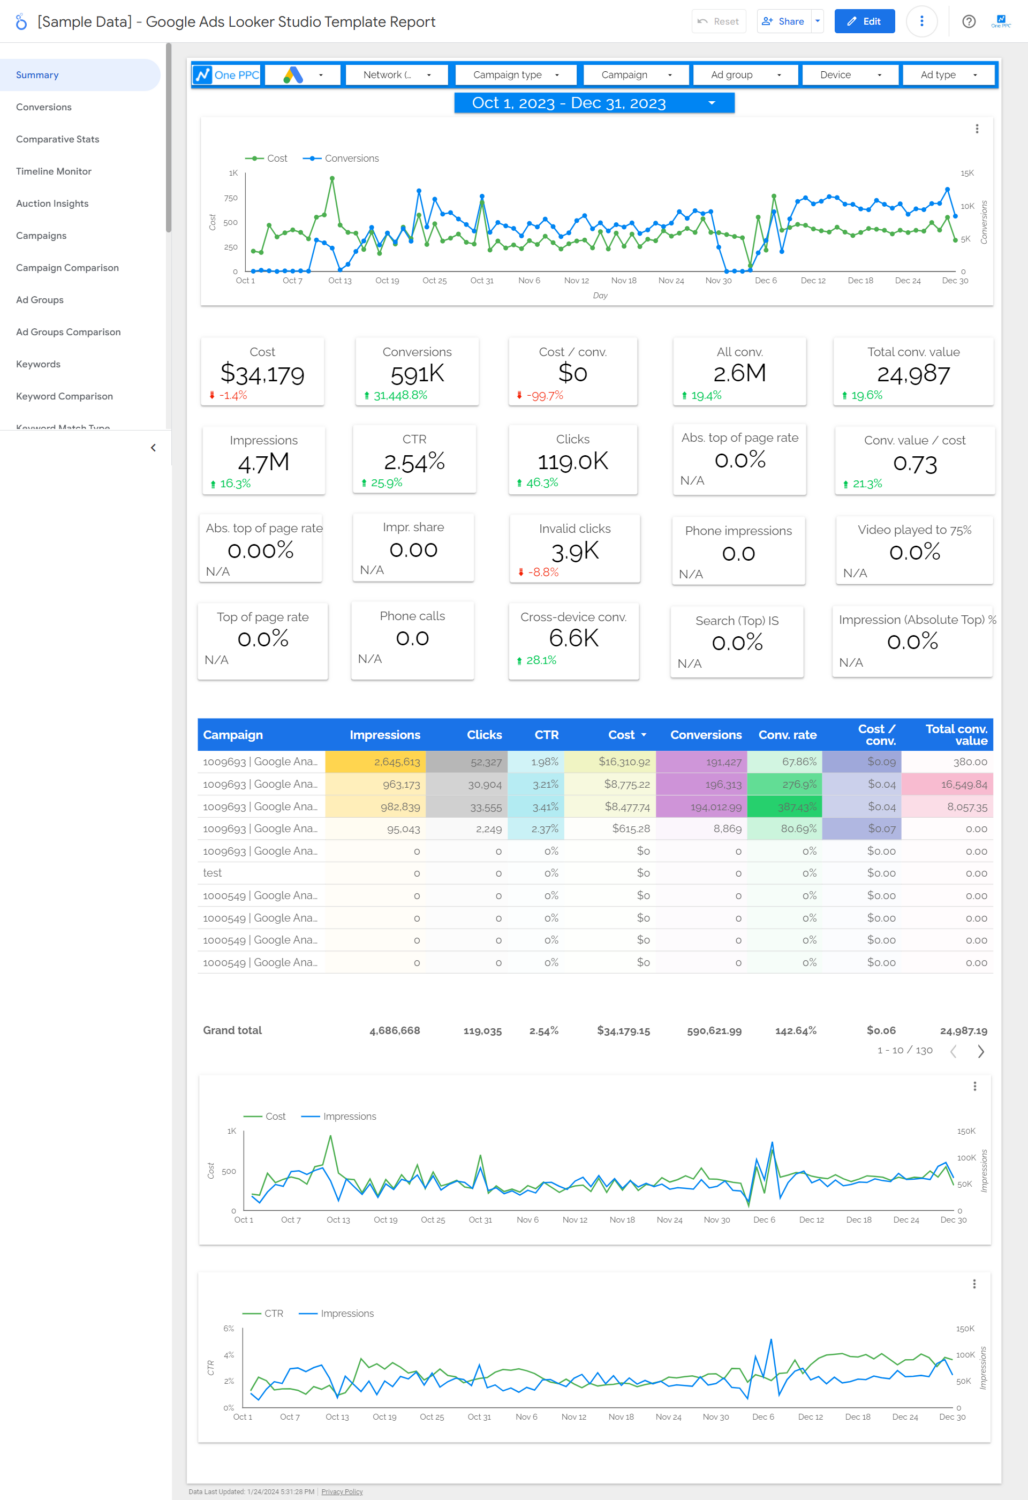
The report’s initial page serves as a dashboard, presenting an assortment of high-level statistics that are further elaborated upon in subsequent pages. This summary offers a succinct overview of vital metrics and dimensions, which are derived directly from Google ads, providing an immediate snapshot of critical performance indicators to promptly evaluate your Google advertising efficacy.
The Key Performance Indicators (KPIs) displayed on this page have been selected to underscore the most pertinent aspects of your data. These metrics and dimensions furnish insights into various essential areas, including user engagement, conversion rates, audience and ad performance, and other significant factors that determine your digital footprint’s success.
By scrutinising this summary page, you’re equipped to develop a top-tier understanding of your website or application’s performance and discern areas that may necessitate further analysis or enhancement.
For a more granular examination of your data, you’re encouraged to navigate the succeeding pages of the template. These pages delve deeper into particular areas of interest and offer additional visualisations and reports, thereby providing a more holistic perspective of your Google data.
Historical Comparison
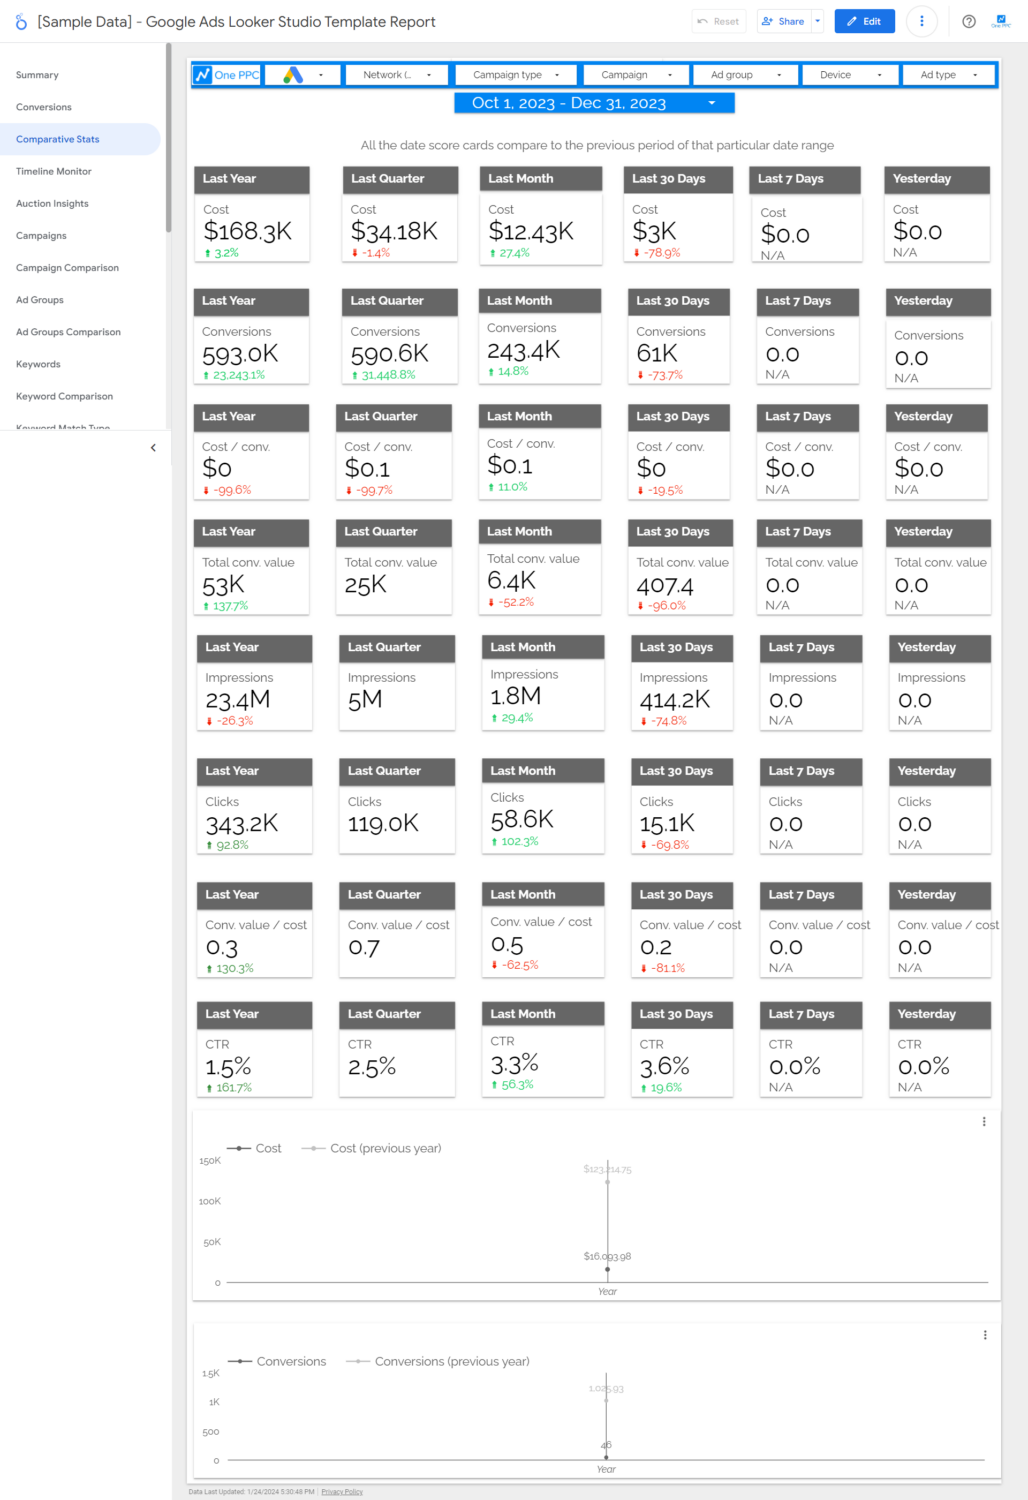
The report template’s historical comparison section is equipped with scorecard charts, representing crucial data points for temporal comparison, thus enabling the tracking of performance trends for your website or application.
These scorecards exhibit metrics including impressions, clicks, conversions, leads, spend, cost per lead, cost per conversion, and more. By juxtaposing these metrics across diverse time periods, patterns, fluctuations, and notable shifts in your website or application’s performance can be discerned. It’s noteworthy that these scorecards operate independently from the default calendar, situated in the menu bar on each page’s right side.
The historical comparison facility furnishes invaluable insights into your Google advertising’s growth, trends, and efficacy. It allows for the assessment of the influence of various elements, such as campaigns or landing pages, on user engagement and conversions.
Leverage these scorecard charts to monitor and evaluate your key metric progression, facilitating data-informed decision making and optimisation strategies to augment your overall performance.
Campaign - Summary
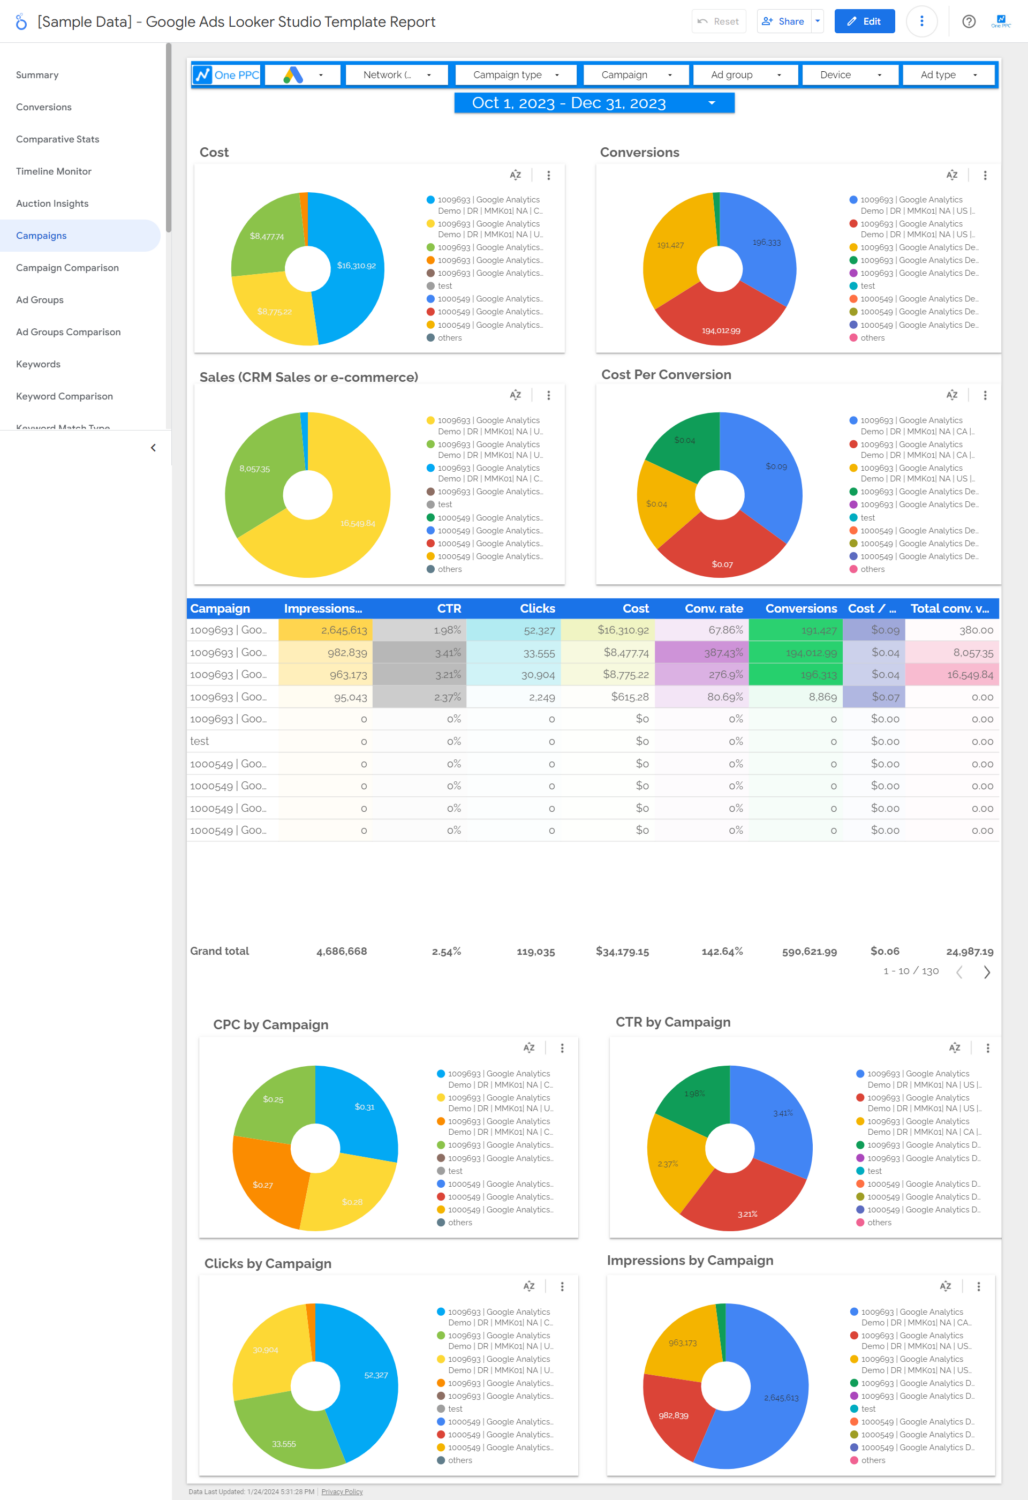
This particular segment of the report delivers a comprehensive analysis of your Google Ads campaign performance. It encapsulates a multitude of reporting charts, including tables, doughnut charts, and pie charts, designed to present your data in a diverse array of formats. This range of visuals serves to enhance the clarity and comprehensibility of the information, making it more accessible whether you’re looking for a high-level overview or more granular insights.
The tables in the report provide a structured view of your campaign performance metrics, effectively organising data to enable clear comparisons across different campaigns, ad types, or timeframes. This format is particularly suited for presenting complex data in a digestible manner, making it simpler to identify trends, spot anomalies, and evaluate your campaign’s efficacy.
Doughnut and pie charts, on the other hand, excel at presenting proportional or percentage data. By representing such data visually, these charts facilitate a quick grasp of the relative performance or significance of different campaign elements. Whether you’re assessing the proportion of total ad spend attributed to each campaign or the percentage of conversions yielded by different ad types, these charts can instantly communicate the bigger picture.
In addition, this report page offers a launching pad for further in-depth analysis. Each chart and table can act as a springboard for exploration, prompting you to drill down into the details when you spot intriguing patterns or surprising results. Whether it’s investigating an unexpectedly successful campaign or probing into the causes of a sudden surge in ad spend, the insights this report provides can guide your decision-making process, shape your strategic initiatives, and fuel performance optimisation.
In conclusion, this segment of the report is designed to offer an all-encompassing view of your Google Ads campaign performance. It utilises diverse data visualisation techniques to present your campaign data in a straightforward and intuitive manner, ensuring that you can easily understand, evaluate, and act on the insights it provides.
Conversions
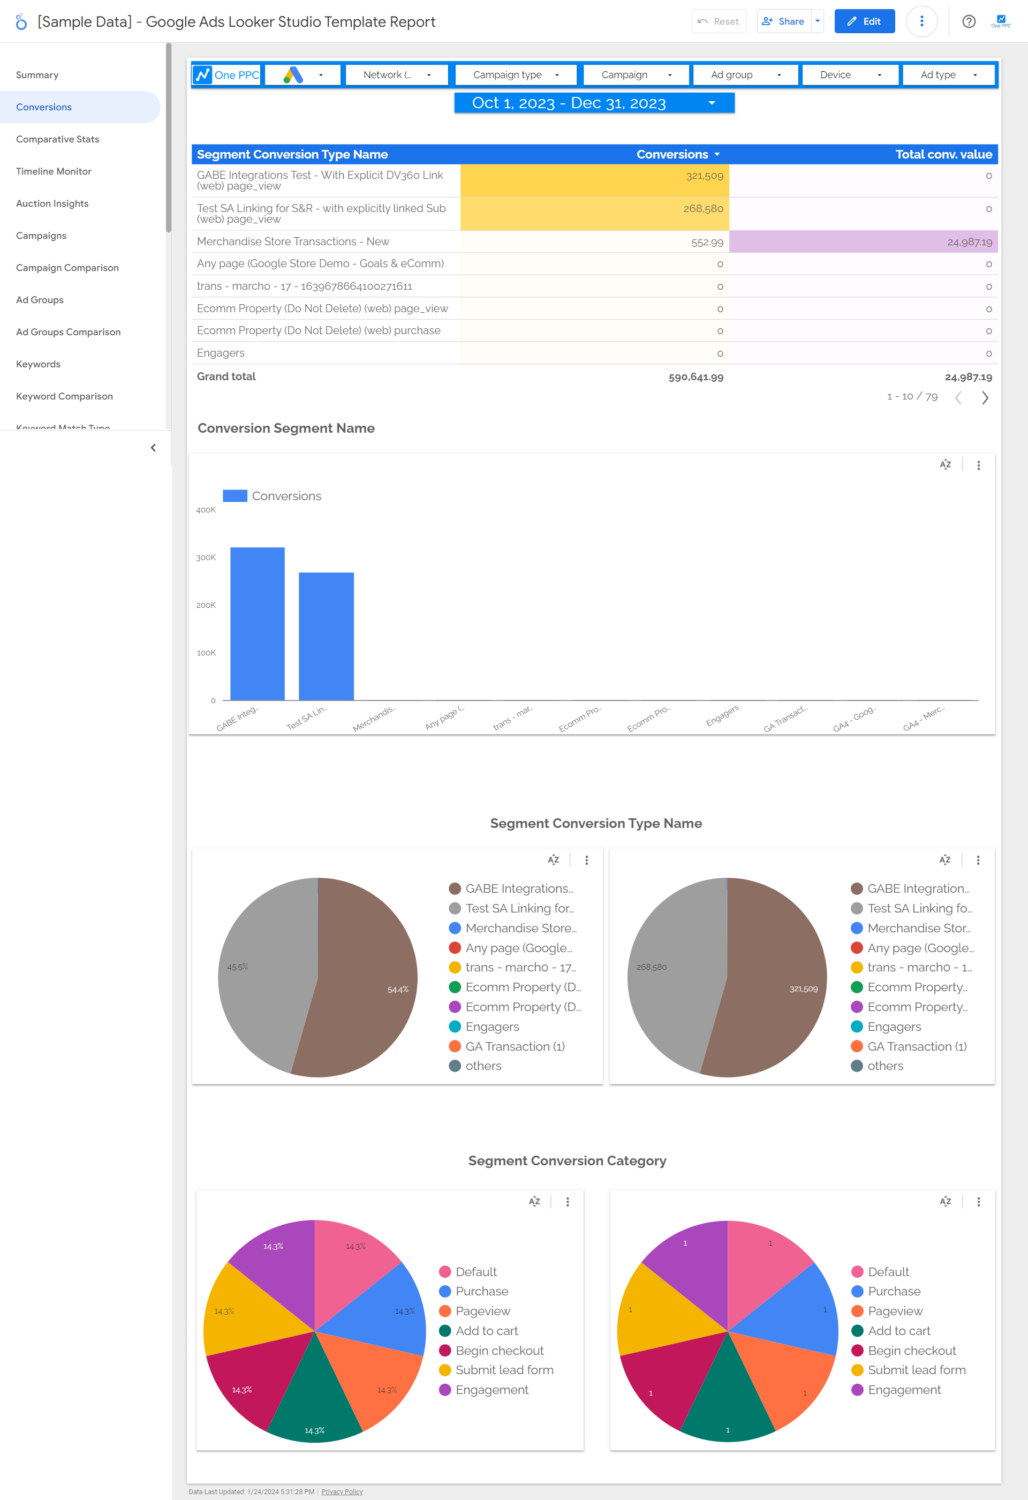
This section of the report offers a comprehensive analysis of your Google campaign’s website conversions. It dissects and elucidates various critical metrics that can inform your understanding of campaign performance, particularly with respect to conversions on your website.
At the core, it illustrates the total amount spent on each campaign, shedding light on the financial resources dedicated to each specific endeavour. When coupled with the resultant conversion data, this provides a clear picture of the financial efficiency of your campaigns and helps in future budget allocation.
Additionally, the average Cost Per Click (CPC) gives you insights into the cost-effectiveness of your adverts. By comparing CPCs across different campaigns, you can identify which efforts yield the most value, guiding your future ad strategy and budget distribution.
One of the key features of this section is the reporting on clicks directed to landing pages and their respective costs per click. These metrics enable you to measure the success of your ads in driving potential customers towards your website or specific webpages. Understanding these figures helps in evaluating your ad’s ability to prompt action, and assists in determining the costs associated with these pivotal conversions.
The report also includes data on the cost per visit to your company page on Google. This provides valuable context for your brand awareness campaigns, offering an insight into the investment needed to attract visitors to your Google business profile.
Lastly, the cost per click (CPC) metric across the board offers a straightforward measure of how much each interaction with your advert is costing your business. This allows you to assess the return on your ad spend and compare the efficiency of different campaigns.
In summary, this website conversions analysis empowers you to understand the intricacies of your campaign performance. It provides a wide range of insights, from spend efficiency to conversion effectiveness, enabling data-driven decision making and paving the way for optimised Google advertising strategies.
Geographical Performance
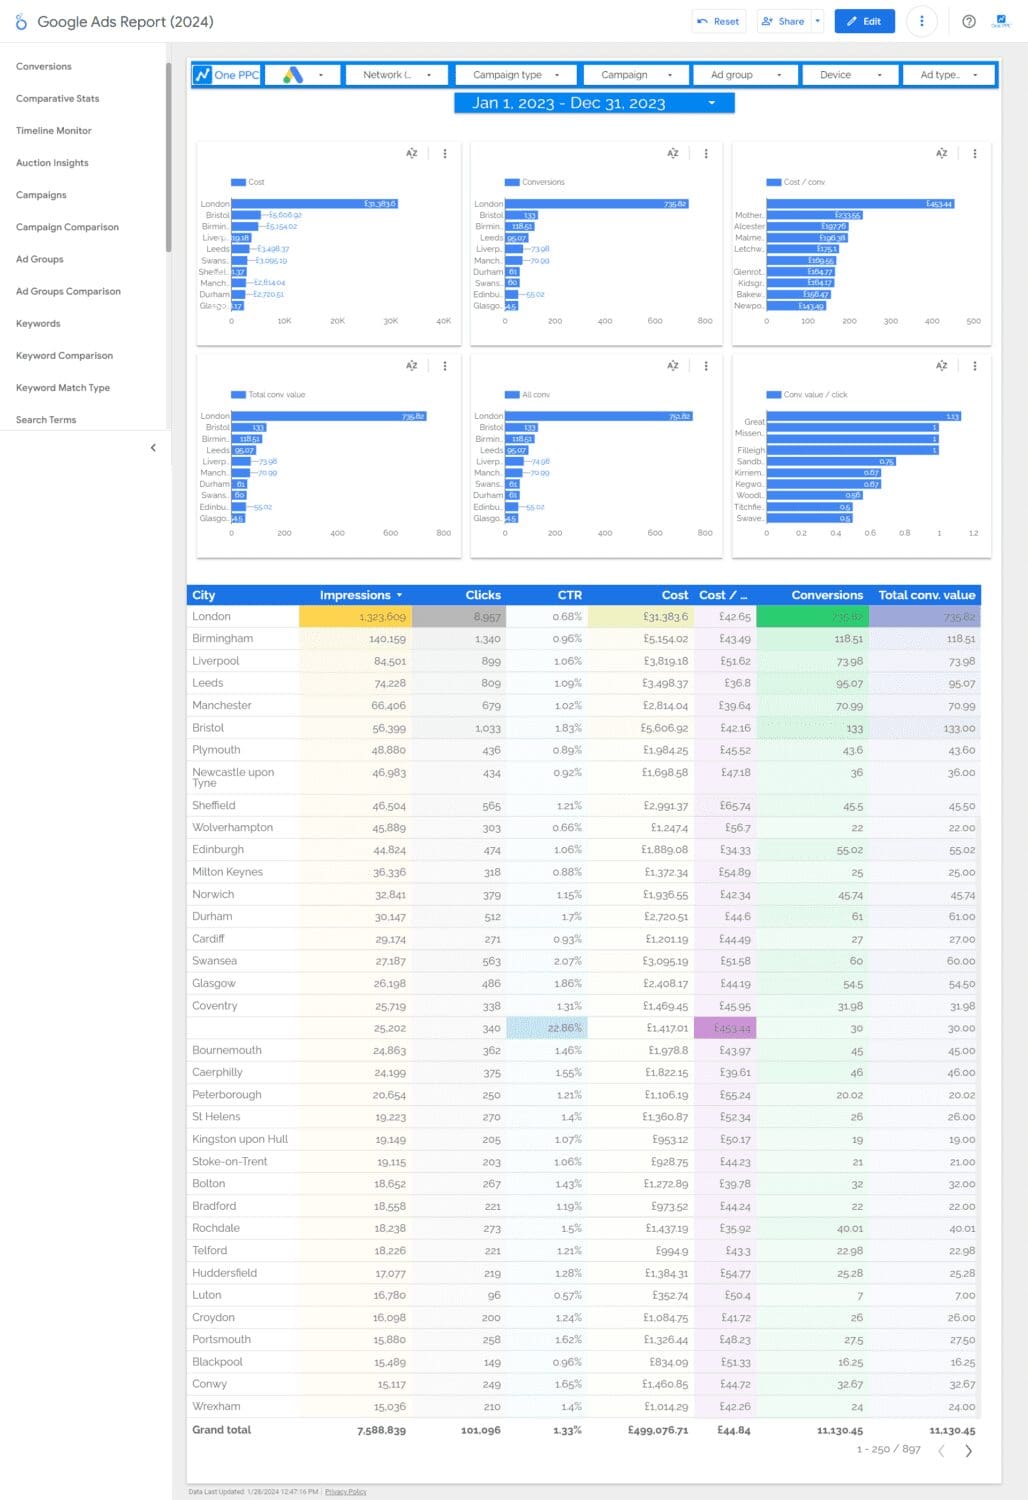
This section of the report provides a geographically oriented performance analysis for your Google advertising campaigns. Understanding the geographical spread of your leads and conversions is paramount to adapting your marketing strategy, customising campaigns, and achieving better targeting.
Specifically, this report examines key dimensions by location, such as the number of leads generated by country. By comparing lead generation across different countries, you can identify where your marketing efforts are most successful and potentially reallocate resources to capitalise on high-performing regions.
The report also presents the ‘Cost Per Lead’ by location, an essential metric that gauges the cost-effectiveness of your campaigns in different regions. A lower cost per lead could indicate a more efficient campaign, providing a strong return on investment in that particular region.
Similarly, the report shows the ‘Number of Conversions’ by country. This allows you to understand which regions are yielding the highest conversions, thereby informing decisions about where to concentrate your marketing efforts.
The ‘Cost per Conversion’ by location is also included, providing insights into the financial efficiency of your campaigns across different regions. A lower cost per conversion in a given country could suggest that your campaign is more effective there, offering an excellent return.
Through these metrics, this geographically focused report empowers you to tailor your Google advertising strategy to each location’s unique performance, thereby optimising your campaign execution, enhancing your lead and conversion rates, and ultimately improving your return on investment.
Timeline Monitor
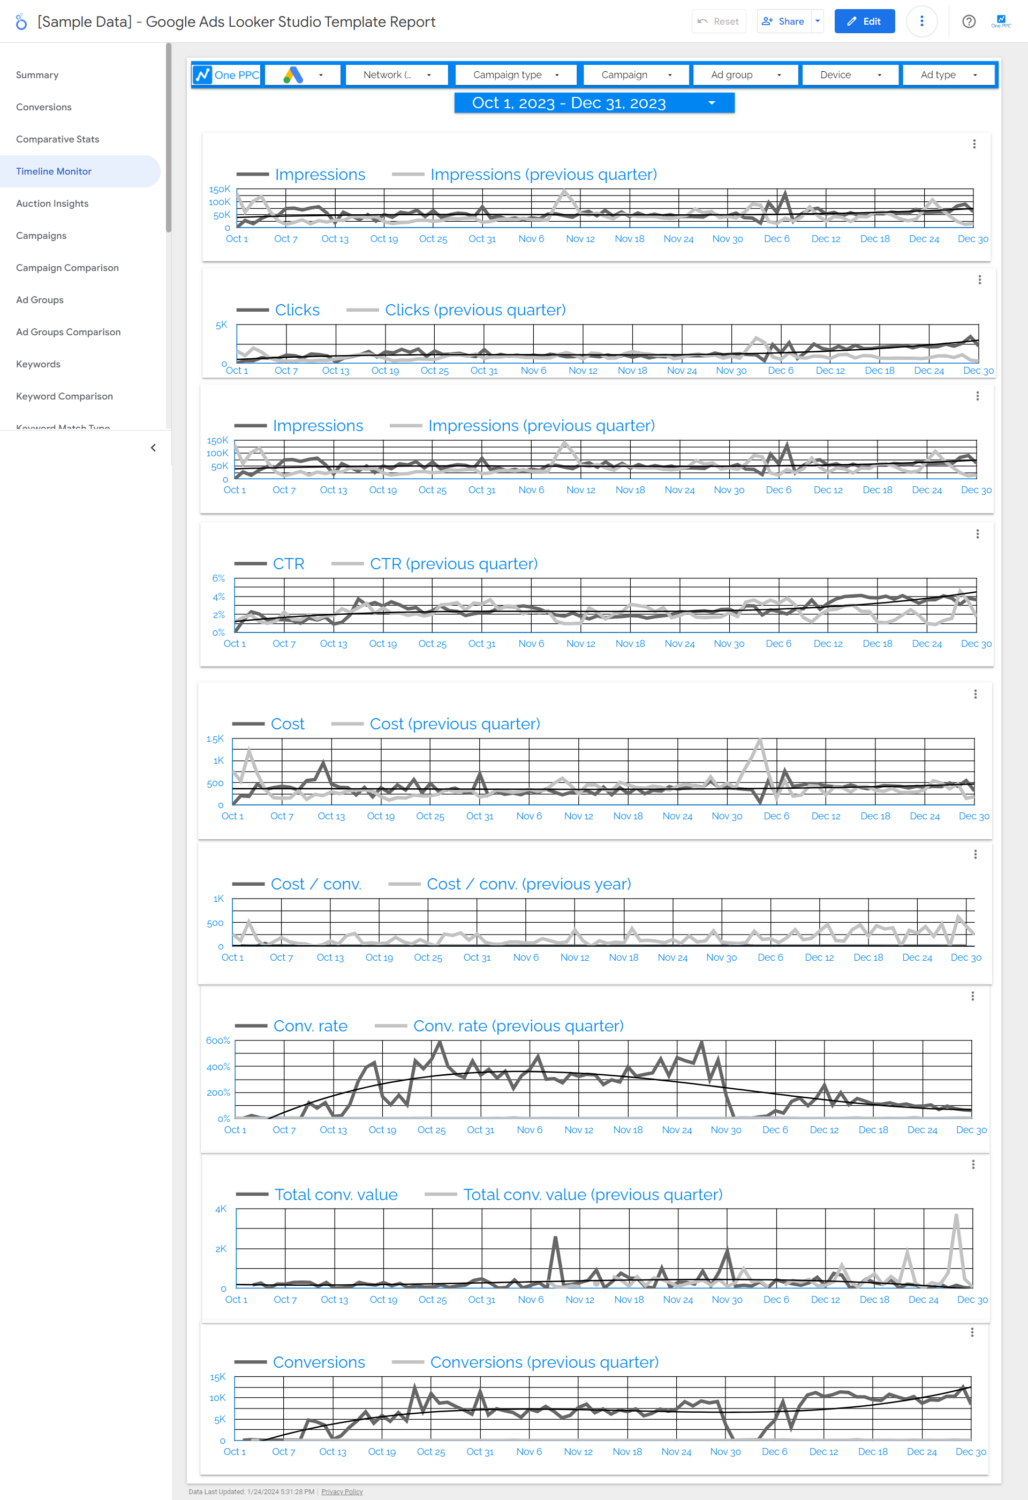
The Timeline Monitor page in our Google Ads Looker Studio Template Report provides a dynamic visual representation of your ad campaign’s performance over time. This section is designed to track and display trends in key metrics such as impressions, clicks, conversions, and spend. The timeline view allows you to easily identify patterns, peak periods, and any anomalies in your campaign’s performance. This insight is crucial for understanding the effectiveness of your ad strategies over different timeframes and making informed decisions for future campaigns.
Monthly Stats
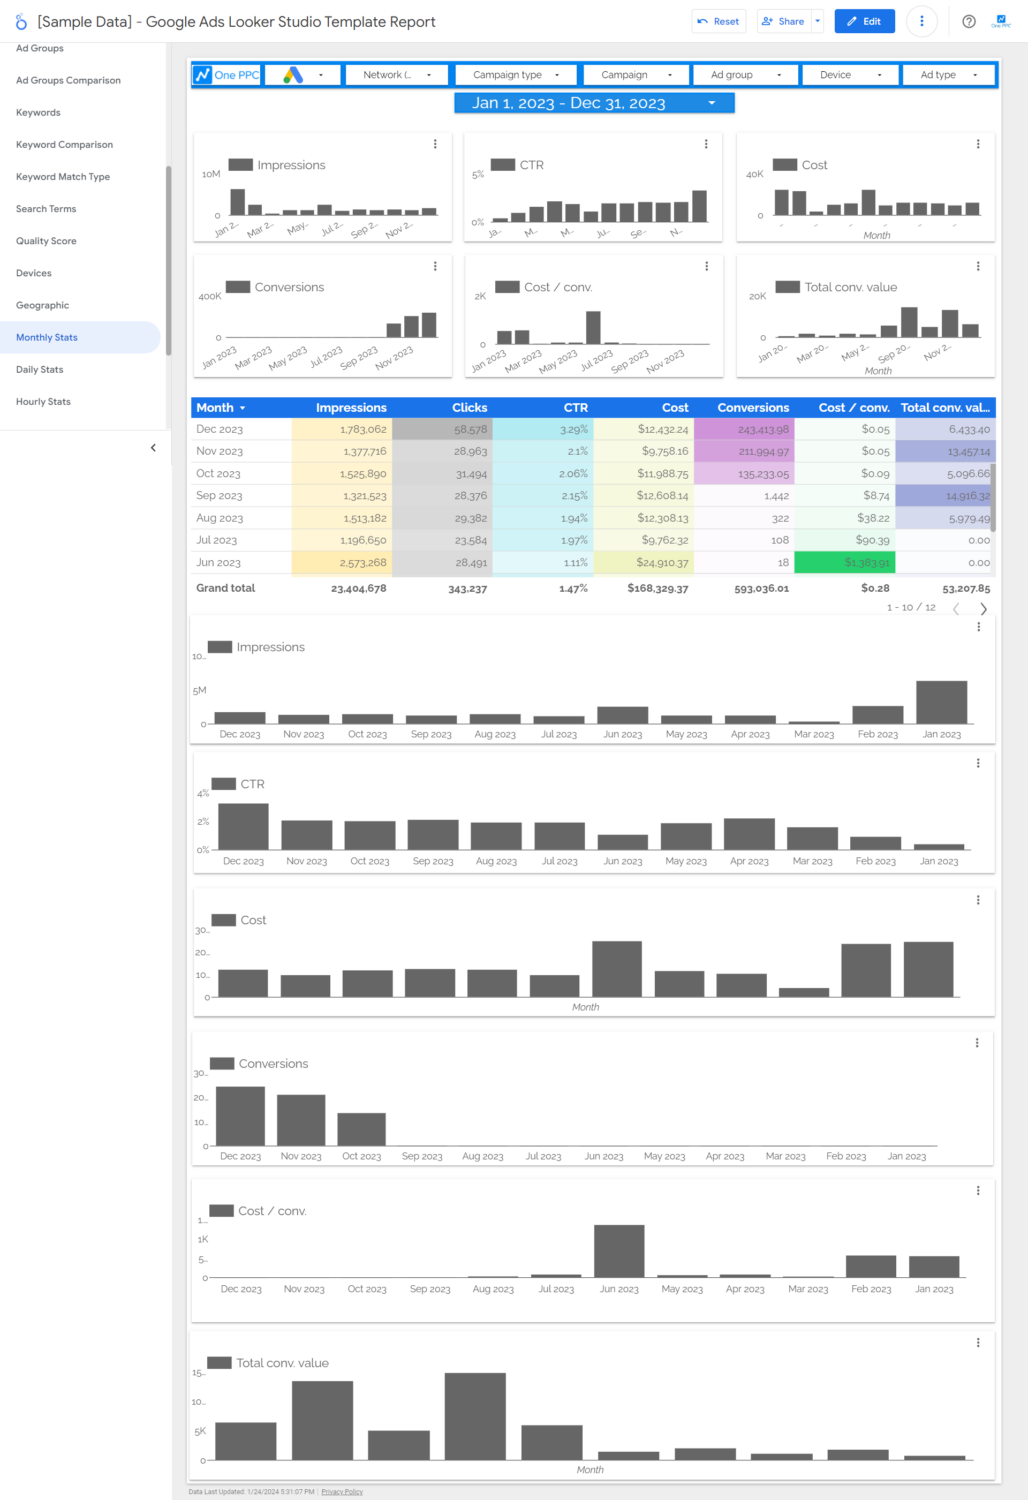
In the Monthly Stats section, our report offers a detailed breakdown of your Google Ads performance on a month-by-month basis. This comprehensive analysis includes metrics such as total spend, conversions, conversion rate, and cost per conversion. By examining these monthly statistics, you can gain a clear understanding of how your campaigns are trending over time, identify seasonal variations, and make strategic adjustments to optimise your advertising efforts for better results.
Devices
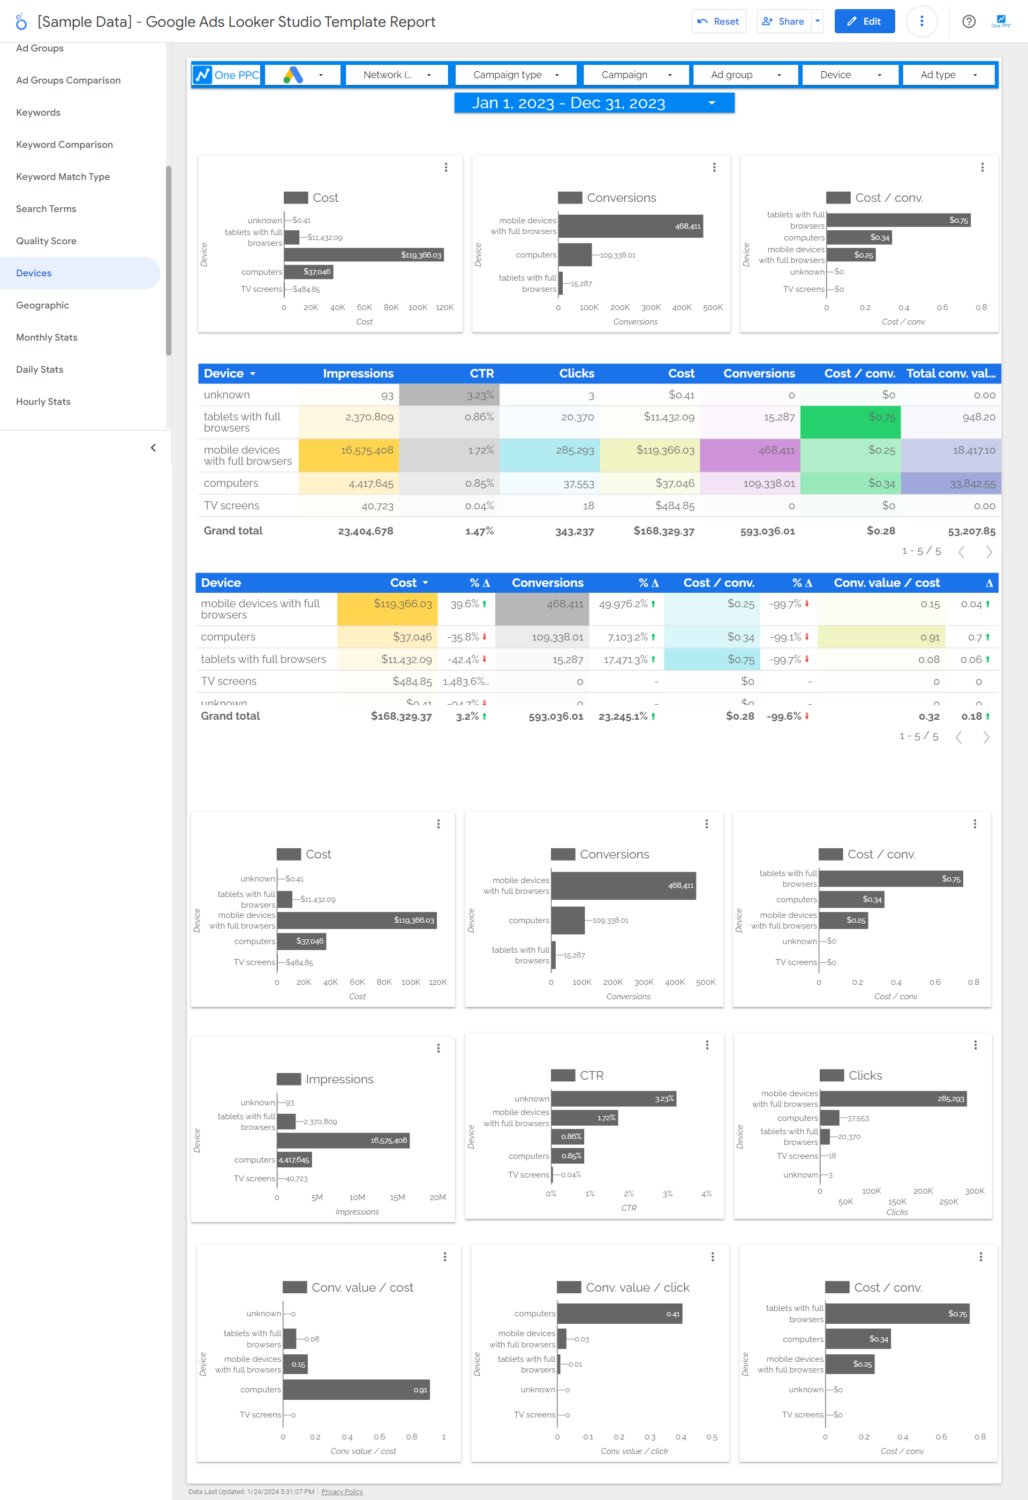
The Devices page in our report provides a thorough analysis of how your ads perform across different devices, including desktops, tablets, and mobile phones. This section helps you understand user preferences and behaviour, enabling you to tailor your campaigns for optimal engagement and conversion rates on each device type. By analysing metrics such as device-specific clicks, impressions, and conversion rates, you can make data-driven decisions to allocate your budget effectively and enhance the user experience.
Quality Score
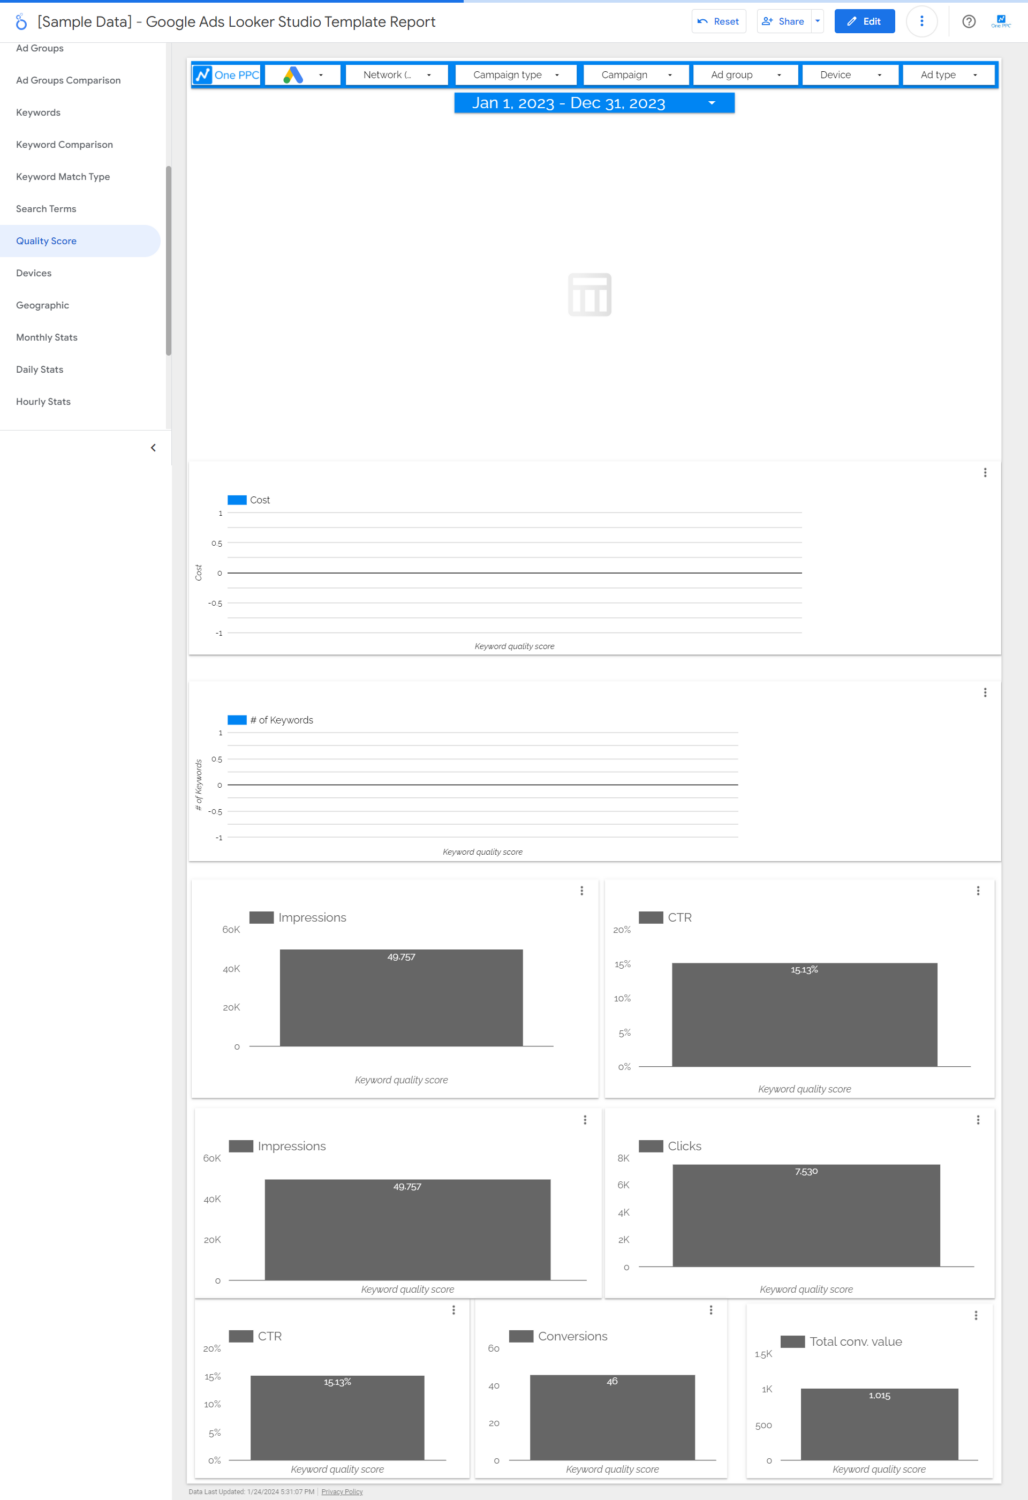
Our Quality Score section delves into the critical aspect of your Google Ads campaigns by evaluating the quality scores of your keywords. This page presents an analysis of factors such as ad relevance, landing page experience, and expected click-through rate. Understanding and improving your quality scores is essential for achieving better ad positions at lower costs, ultimately leading to more efficient and effective campaigns.
Keywords
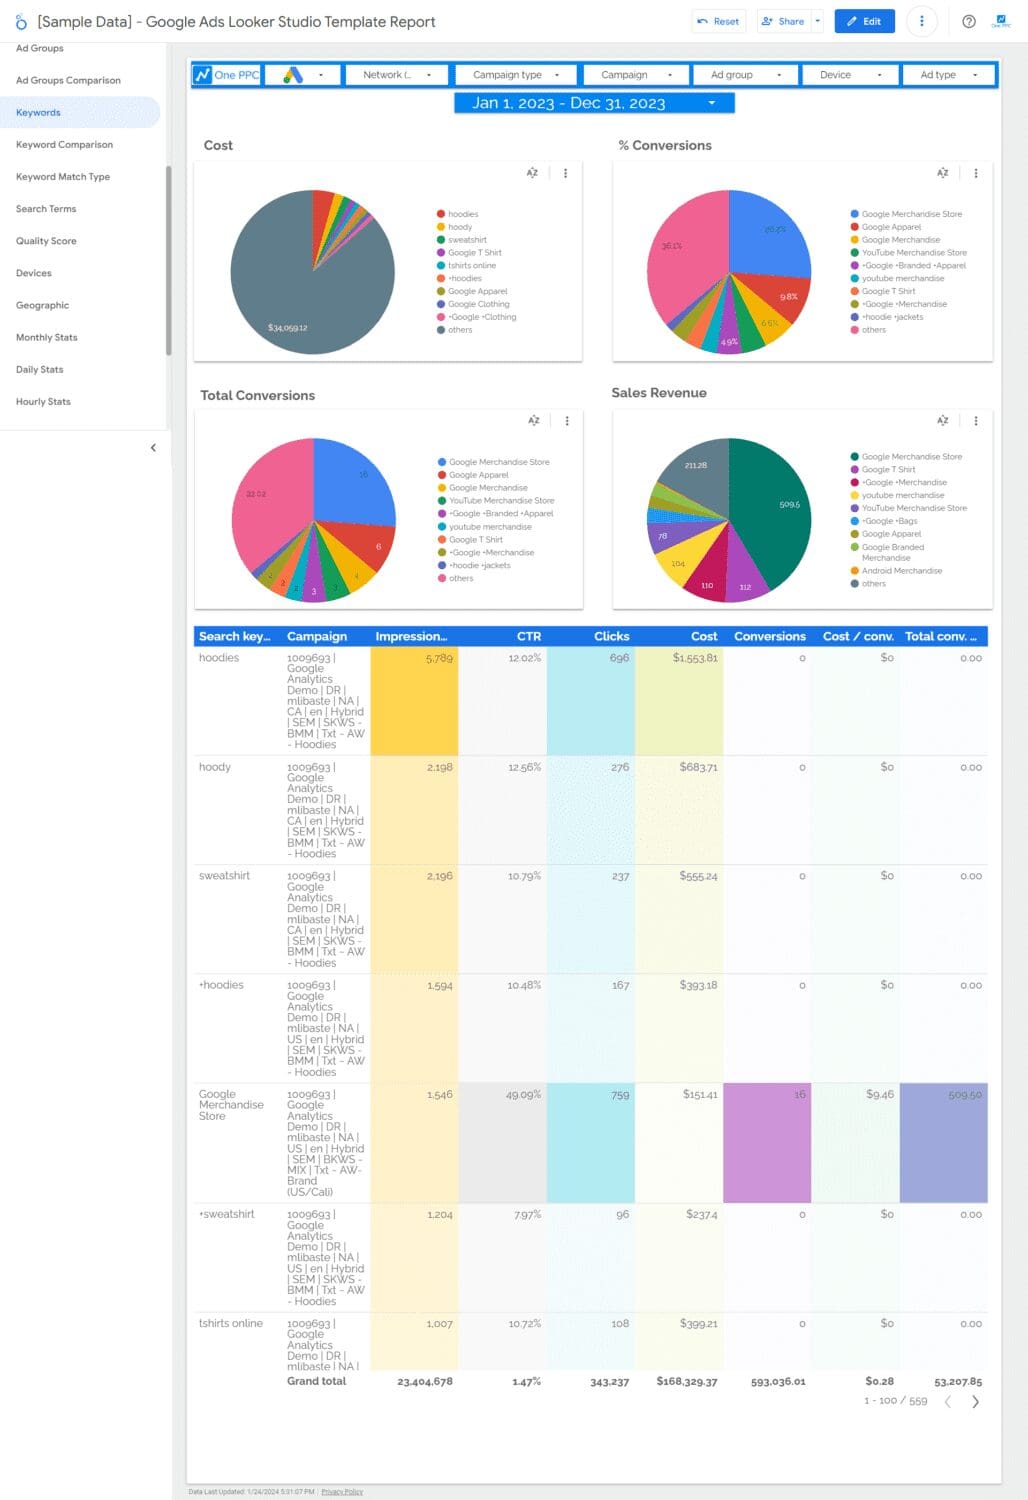
In the Keywords section, we provide an in-depth look at the performance of the keywords used in your campaigns. This analysis covers aspects such as search volume, click-through rates, cost per click, and conversions. By closely monitoring and optimising your keyword strategy, you can enhance the relevance and effectiveness of your ads, leading to higher conversion rates and a better return on investment.
Ad Groups
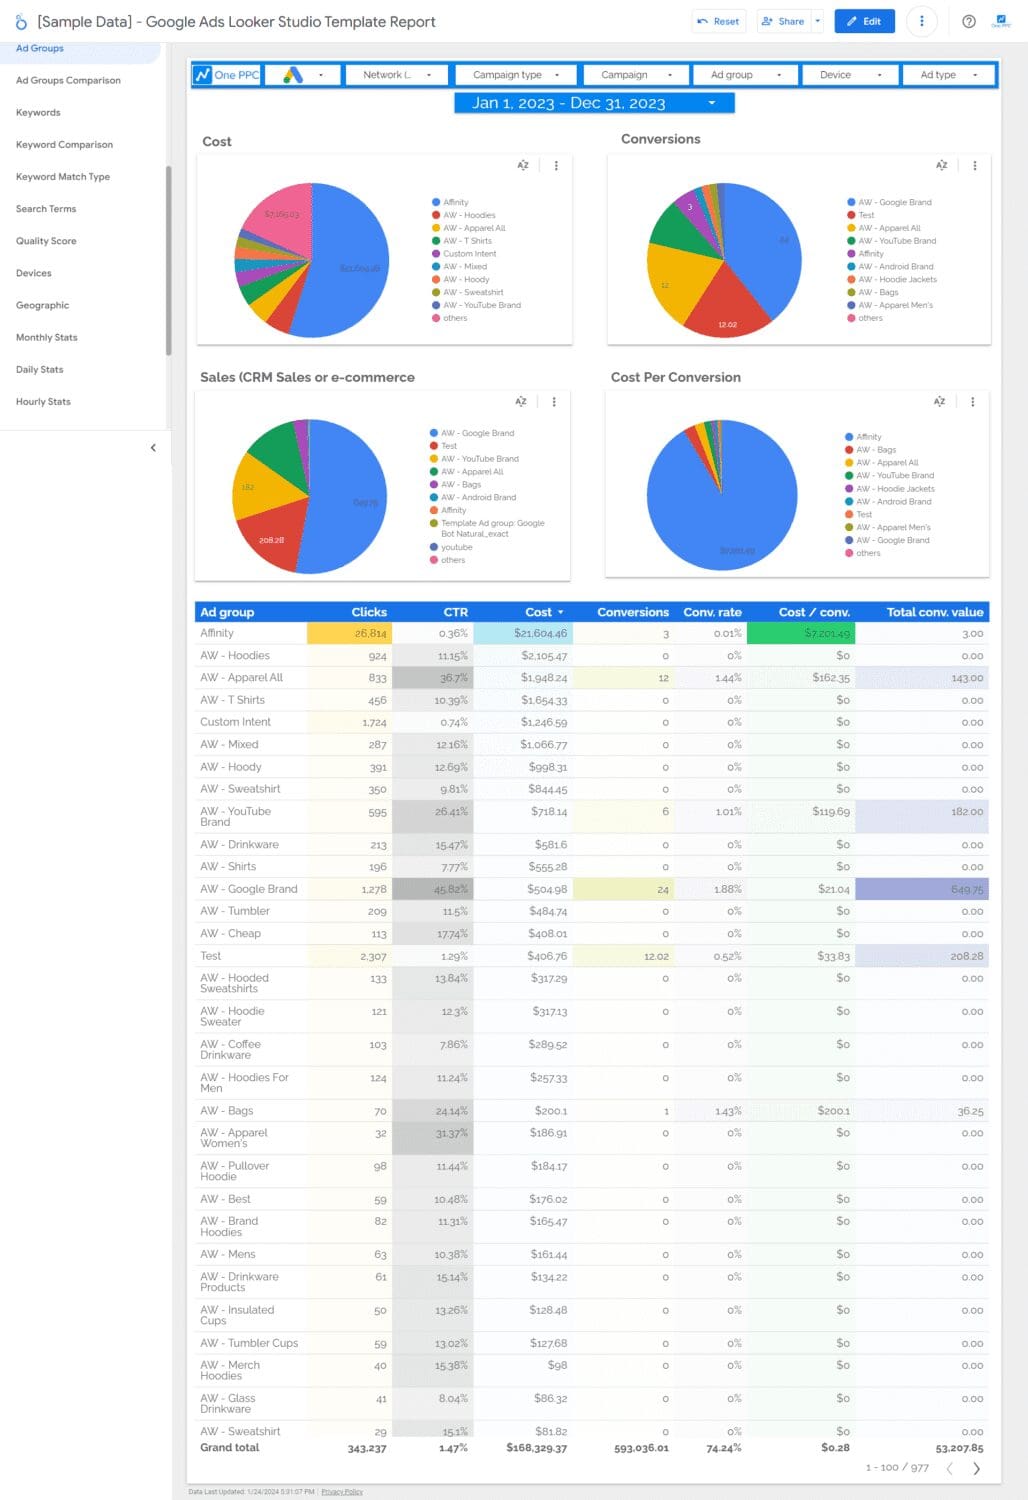
The Ad Groups page offers a detailed examination of your campaign’s ad group performance. This section highlights key metrics such as impressions, clicks, conversions, and cost per conversion for each ad group. By analysing this data, you can identify which ad groups are performing well and which require optimisation, allowing you to refine your ad targeting and messaging for improved campaign results.
Auction Insights
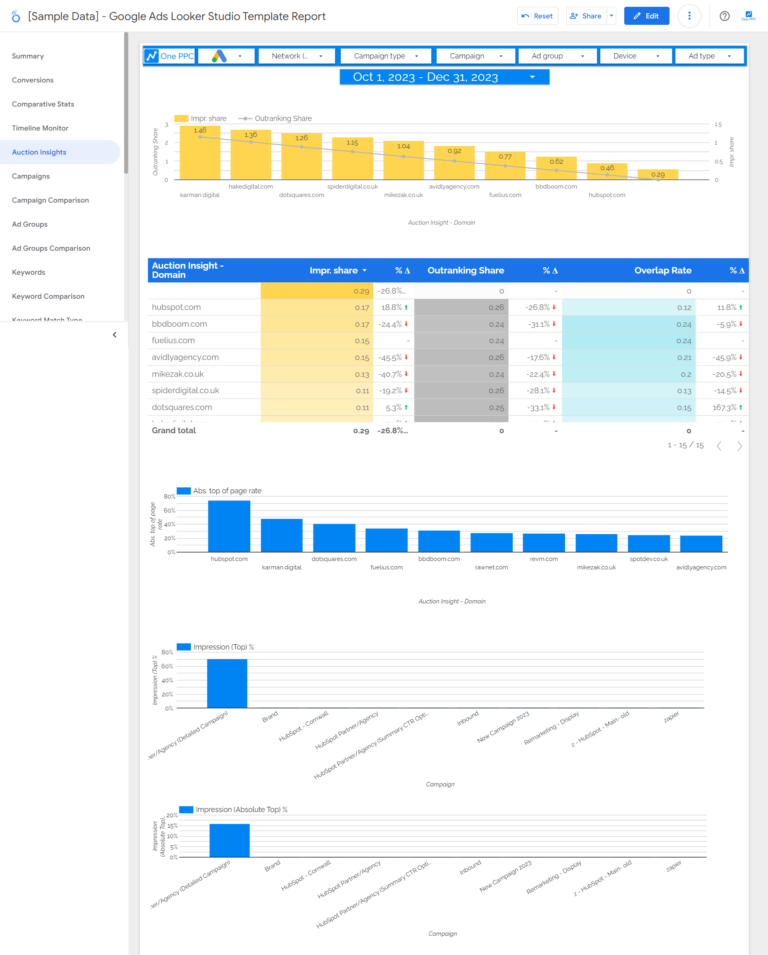
Our Auction Insights section provides a comprehensive analysis of your competitive landscape on Google Ads. This page reveals how your campaigns stack up against competitors in terms of impression share, average position, overlap rate, and other critical metrics. By understanding your position in the auction, you can make strategic decisions to outperform competitors and capture a larger share of your target audience.
Get Free Template Now!
Summary
In conclusion, our Google Ads Looker Studio Template is an essential tool for enhancing your Google advertising campaigns. With its comprehensive analytics and user-friendly interface, it provides deep insights into ad performance, enabling data-driven decision-making. Whether you’re analysing trends, device usage, quality scores, or competitive positioning, this template offers valuable perspectives to optimise your strategies and improve return on ad spend (ROAS).
This template is designed for marketers at all levels, offering an intuitive and accessible way to navigate and interpret your advertising data. By utilising this powerful tool, you can gain a competitive edge, drive better results, and contribute significantly to your business’s growth.
Download our free Google Ads Looker Studio Template now and transform your Google Ads data into actionable insights for more effective and efficient digital advertising.